DataAnalysis-Portfolio
Portfolio Projects
Following are my projects in SQL, R, Python, Tableau & Excel
My linkedln profile : Sumaya A
-
SQL & Tableau - Covid Data in SQL and Visualization in Tableau
See on Tableau Public : Dashboard
Review the Data Insertion SQL Script :HERE
Review the Data Exploration SQL Script :HERE

-
SQL -
SQL challenge-Case Study Danny’s Diner-Data Cleaning
Review the Case Study :HERE
Review the Schema :HERE
Review the SQL Script :HERE
Entity-Relationship Digram:

-
R - Bike Share Marketing Analysis in R and Presentation in Tableau
Analyze 12 months of Divvy data to see how we can convert casual riders into annual members Use tidyverse to wrangle data, dplyr to clean data, lubridate to wrangle date attributes, ggplot2 to visualize data, and readr to save csv for further analysis
Review the Case Study :HERE
Review the Tableau Public:HERE

-
Python -
Spotify Data Case StudyA dataset of from 1922-2021 songs tracks from Spotify API. The “data.csv” file contains more than 600.000 songs collected from Spotify Web API, and also you can find data grouped by artist, year, or genre in the data section
Python Libaries Used
pandas, numpy, seaborn, matplotlip
Review the project:HERE
- Tableau
To View these Tableau Dashboards in Tableau Public, click on the hypertext link
-
#MakeoverMonday 2023 Week 5 NYC PIZZA SLICES

- Sample SuperStore

- #MakeoverMonday 2021 W7-What’s the point of Valentines day

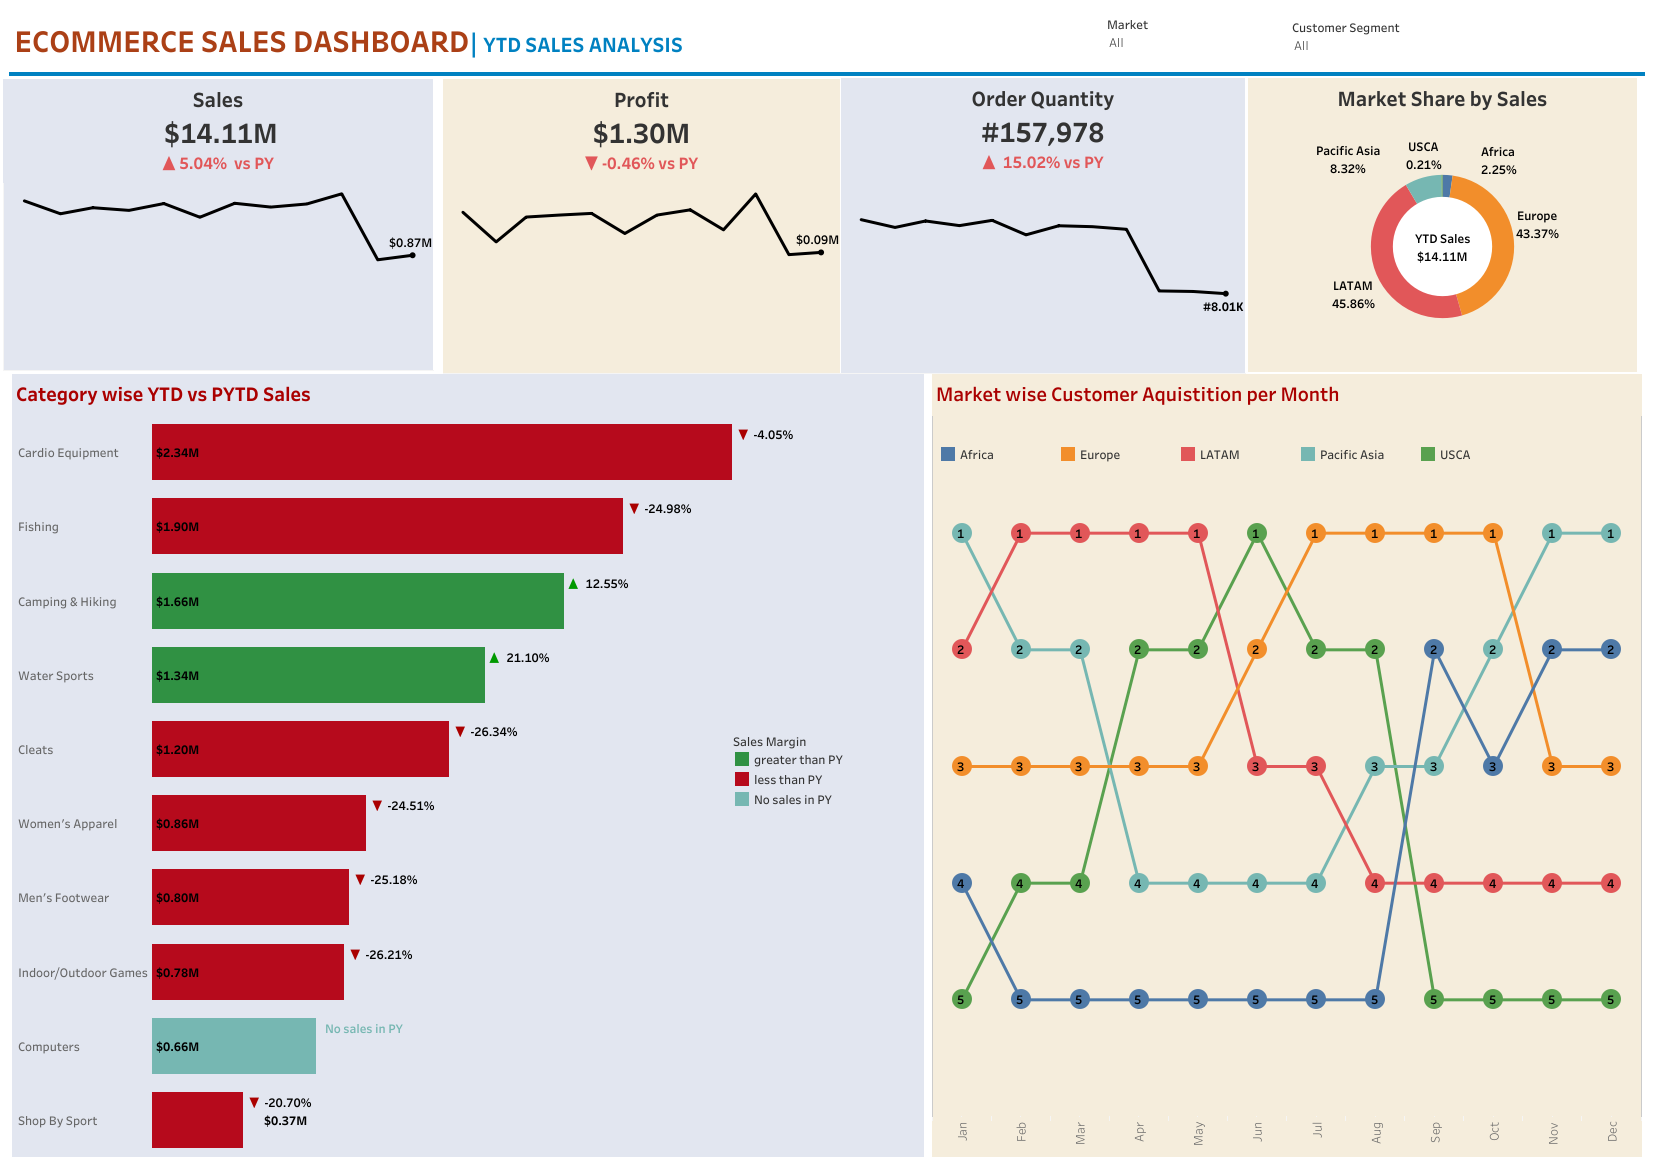
- SALES DASHBOARD

-
Layoff(2020-2023)

-
ECOMMERCE SALES 2023
- HR Analytics 2023

- CREDIT CARD COMPLAINTS DASHBAORD

- EXCEL Kindly download these Excel files from this repository and view them in Microsoft Excel
Sales Superstore Sample: Sales Performance Dashboard

- EXCEL Kindly download these Excel files from this repository and view them in Microsoft Excel
Adidas US interactive Sales DASHBOARD

-